import os
import numpy as np
import xarray as xr
import matplotlib.pyplot as plt
import matplotlib.colors as colors

import getpass
import act
# Note - recommended ARM Live token to be set as an environmental variable
# Check for env variables, otherwise set your username and token here!
if "ARM_USERNAME" in os.environ:
arm_username = os.getenv("ARM_USERNAME")
else:
arm_username = input("ARM_USERNAME: ").strip()
if "ARM_TOKEN" in os.environ:
arm_token = os.getenv("ARM_TOKEN")
else:
arm_token = getpass.getpass("ARM_TOKEN (hidden): ").strip()
# Set the datastream and start/enddates
ef_datastream = 'nsametC1.b1'
startdate = '2015-06-13'
enddate = '2015-06-13'
result_nsametC1 = act.discovery.download_arm_data(arm_username, arm_token, ef_datastream, startdate, enddate)ARM_USERNAME: adorough
ARM_TOKEN (hidden): ········
[DOWNLOADING] nsametC1.b1.20150613.000000.cdf

If you use these data to prepare a publication, please cite:

Kyrouac, J., Shi, Y., & Tuftedal, M. Surface Meteorological Instrumentation
(MET), 2015-06-13 to 2015-06-13, North Slope Alaska (NSA), Central Facility,
Barrow AK (C1). Atmospheric Radiation Measurement (ARM) User Facility.
https://doi.org/10.5439/1786358
ds_met = act.io.read_arm_netcdf(result_nsametC1)

ds_met
Loading...
ds_met['temp_mean'] = ds_met['temp_mean'].where(ds_met['temp_mean']!=-9999)

display = act.plotting.TimeSeriesDisplay(ds_met, subplot_shape=(1,), figsize=(15, 5))
display.plot('temp_mean', subplot_index=(0,), cvd_friendly=True)
plt.show()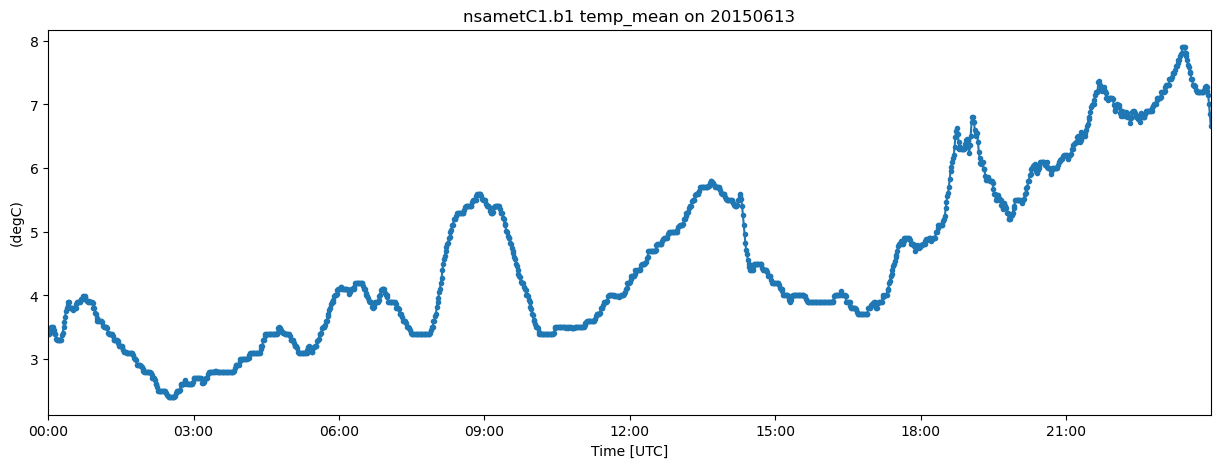
ds_met['dew_point_mean'] = ds_met['dew_point_mean'].where(ds_met['dew_point_mean']!=-9999)

display = act.plotting.TimeSeriesDisplay(ds_met, subplot_shape=(1,), figsize=(15, 5))
display.plot('dew_point_mean', subplot_index=(0,), cvd_friendly=True)
plt.show()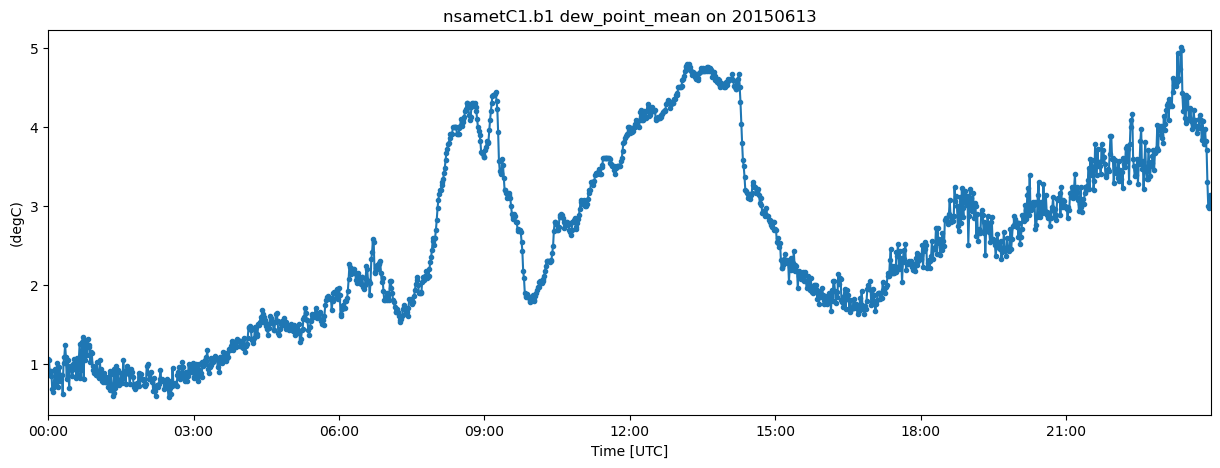
display = act.plotting.TimeSeriesDisplay(ds_met, subplot_shape=(1,), figsize=(15,5))
display.plot('rh_mean', subplot_index=(0,), cvd_friendly=True)
plt.show()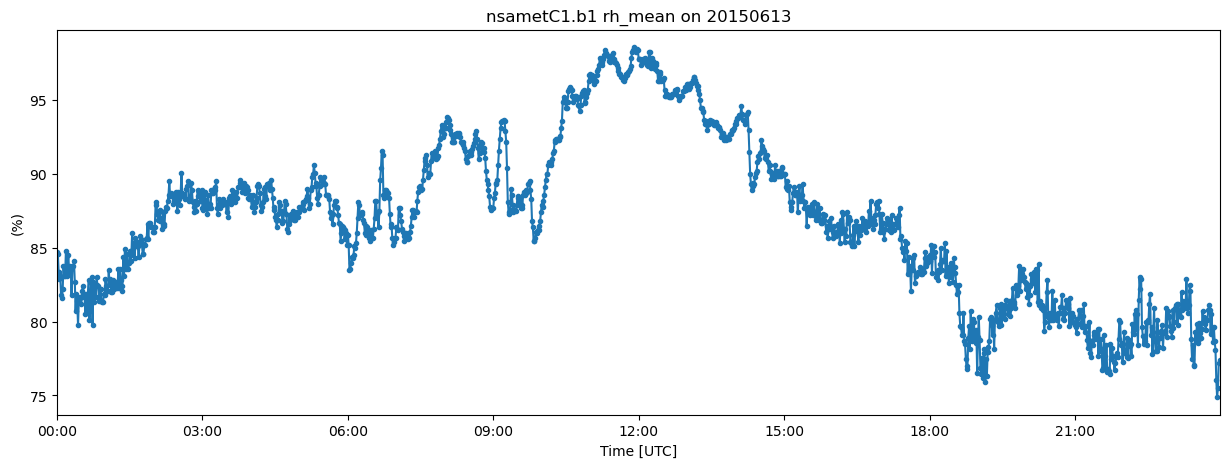
hourly_ds = ds_met.resample(time='1h').max()

display = act.plotting.TimeSeriesDisplay(hourly_ds, subplot_shape=(1,), figsize=(15, 5))
display.plot('pwd_cumul_rain', subplot_index=(0,), cvd_friendly=True)
plt.show()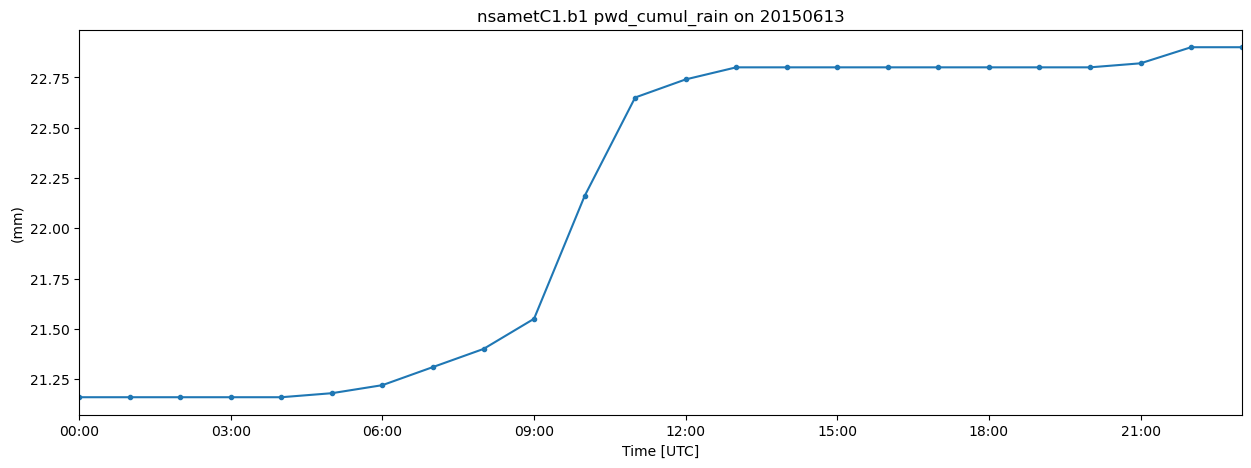
display = act.plotting.TimeSeriesDisplay(ds_met, subplot_shape=(1,), figsize=(15, 5))
display.plot('pwd_cumul_rain', subplot_index=(0,), cvd_friendly=True)
plt.show()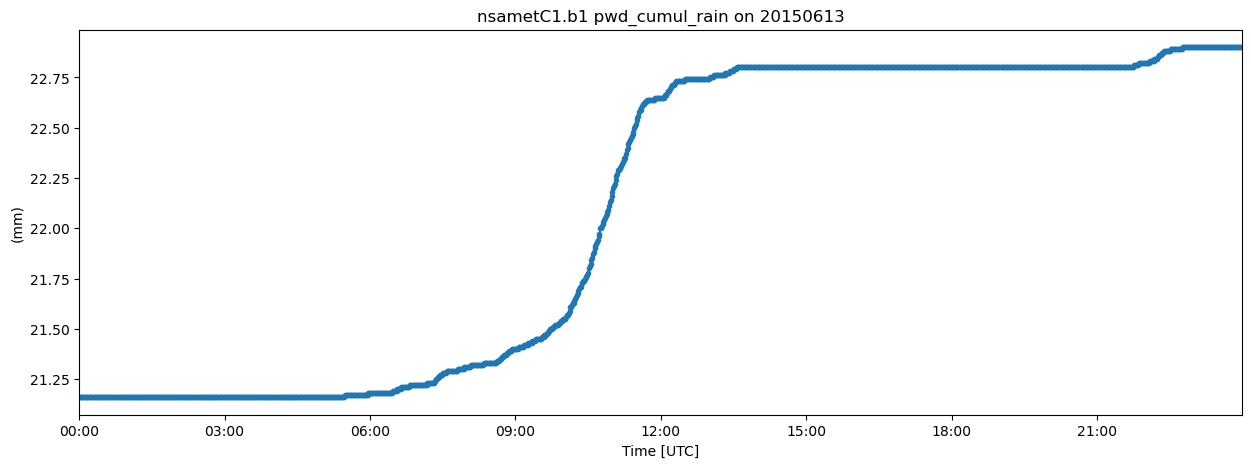
display = act.plotting.TimeSeriesDisplay(hourly_ds, subplot_shape=(1,), figsize=(15, 5))
display.plot('pwd_cumul_snow', subplot_index=(0,), cvd_friendly=True)
plt.show()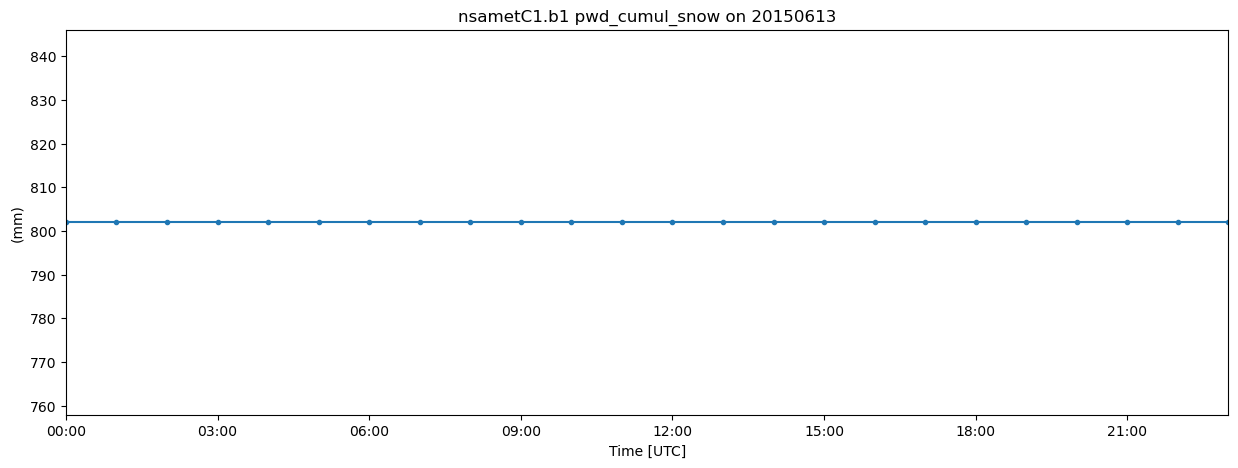
display = act.plotting.TimeSeriesDisplay(ds_met, subplot_shape=(1,), figsize=(15, 5))
display.plot('pwd_cumul_snow', subplot_index=(0,), cvd_friendly=True)
plt.show()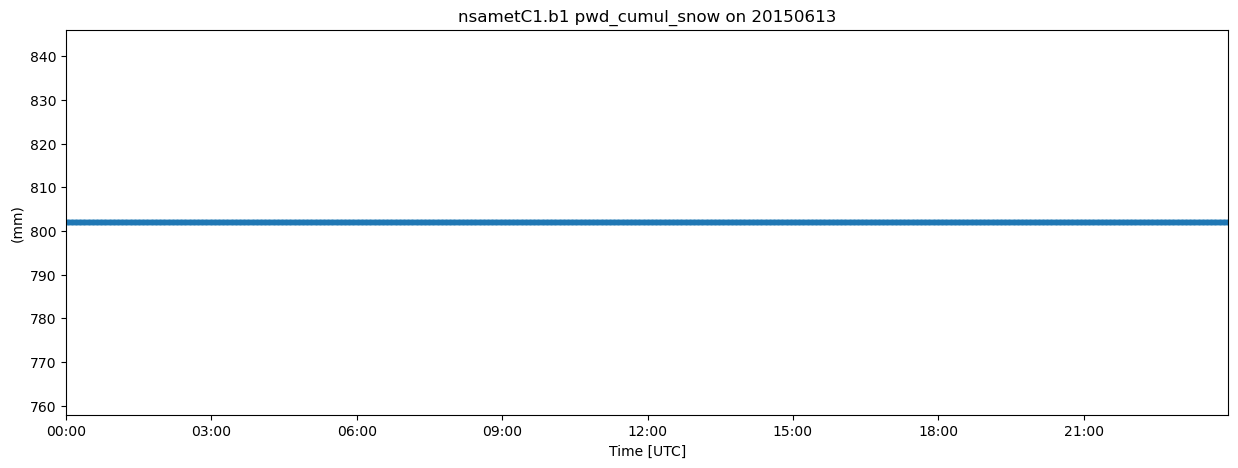
display = act.plotting.TimeSeriesDisplay(ds_met, subplot_shape=(1,), figsize=(15, 5))
display.plot('wspd_vec_mean', subplot_index=(0,), cvd_friendly=True)
plt.show()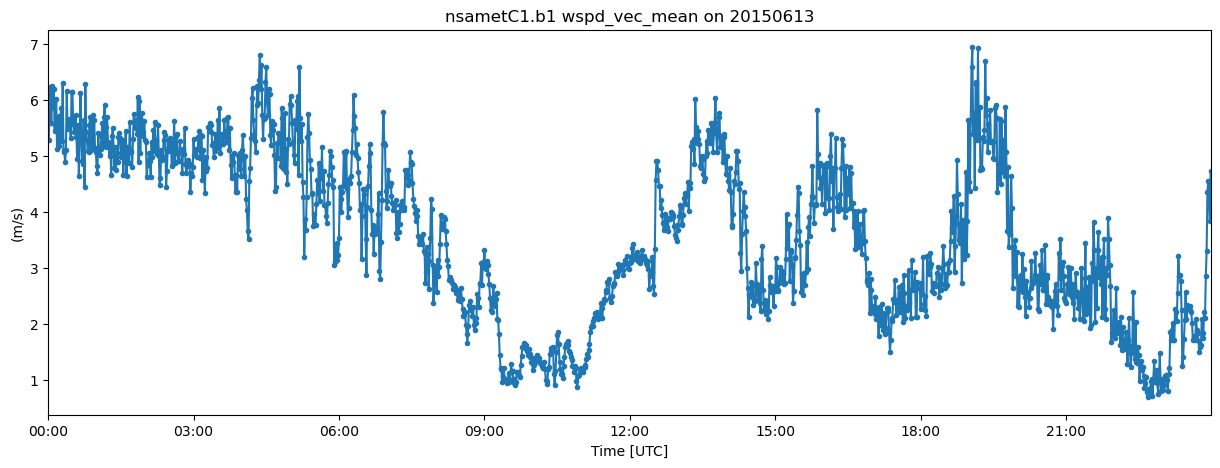
display = act.plotting.TimeSeriesDisplay(ds_met, subplot_shape=(1,), figsize=(15, 5))
display.plot('wdir_vec_mean', subplot_index=(0,), cvd_friendly=True)
plt.show()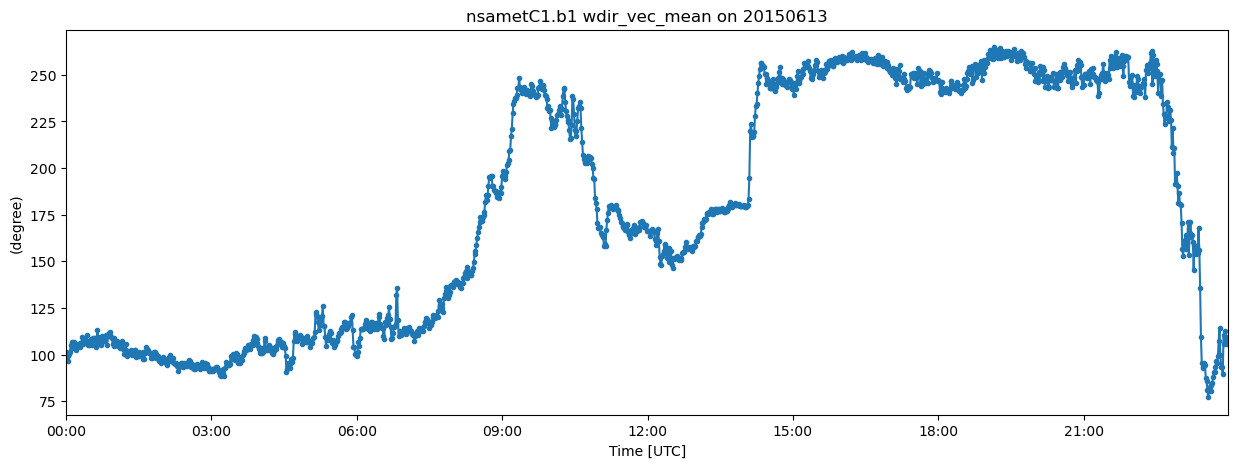
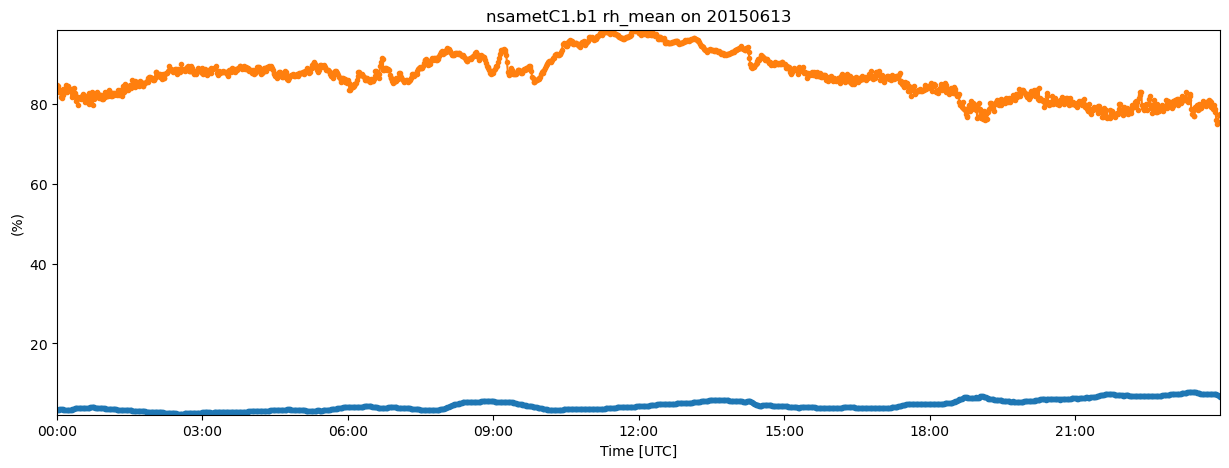
display = act.plotting.TimeSeriesDisplay(ds_met, subplot_shape=(1,), figsize=(15, 5))
display.plot('temp_mean', subplot_index=(0,), cvd_friendly=True)
display.plot('rh_mean', subplot_index=(0,), cvd_friendly=True)
plt.show()