Setup
import os
import numpy as np
import xarray as xr
import matplotlib.pyplot as plt
import matplotlib.colors as colors
import getpass
import act
import datetime
Data Download
# Note - recommended ARM Live token to be set as an environmental variable

# Check for env variables, otherwise set your username and token here!
if "ARM_USERNAME" in os.environ:
    arm_username = os.getenv("ARM_USERNAME")
else:
    arm_username = input("Enter ARM username: ").strip()
if "ARM_TOKEN" in os.environ:
    arm_token = os.getenv("ARM_TOKEN")
else:
    arm_token = getpass.getpass("Enter ARM token (hidden): ").strip()

# Set the datastream and start/enddates
ceil_datastream = 'nsaceilC1.b1'

startdate = '2015-06-13'
enddate = '2015-06-13'

# Use ACT to easily download the data.  Watch for the data citation!  Show some support
# for ARM's instrument experts and cite their data if you use it in a publication
result_ceil = act.discovery.download_arm_data(arm_username, arm_token, ceil_datastream, startdate, enddate)
Enter ARM username: acresanti
Enter ARM token (hidden): ········
[DOWNLOADING] nsaceilC1.b1.20150613.000000.nc

If you use these data to prepare a publication, please cite:

Zhang, D., Ermold, B., & Morris, V. Ceilometer (CEIL), 2015-06-13 to 2015-06-13,
North Slope Alaska (NSA), Central Facility, Barrow AK (C1). Atmospheric
Radiation Measurement (ARM) User Facility. https://doi.org/10.5439/1181954
Visualize Data
# Read data
ceil_ds = act.io.arm.read_arm_netcdf(result_ceil)

# Adjust ceilometer data for plotting
ceil_ds = act.corrections.ceil.correct_ceil(ceil_ds, -9999.0)
# Set time range
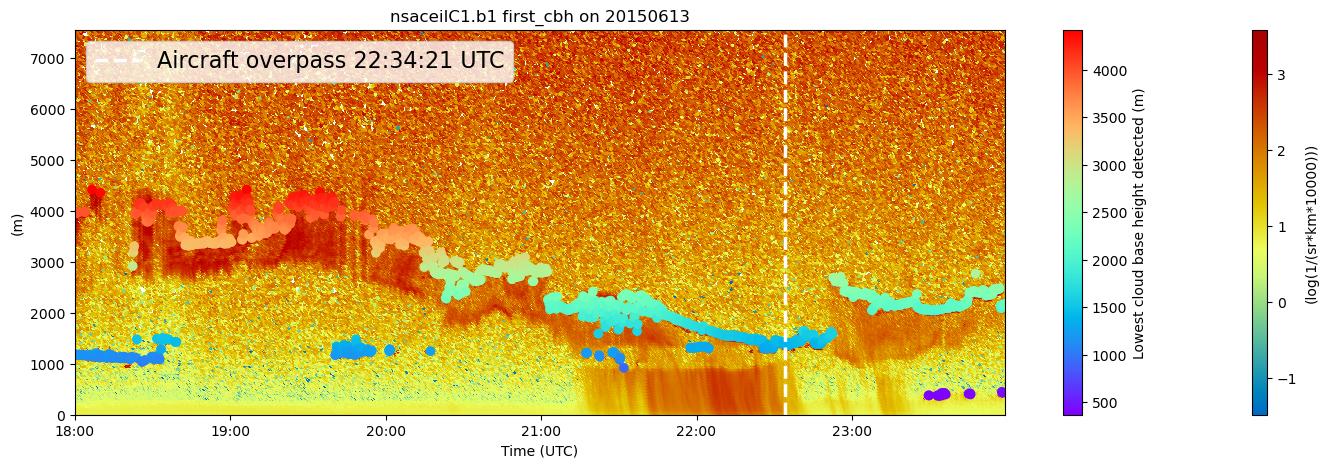
time_rng=(datetime.datetime(2015, 6, 13, 18, 0), datetime.datetime(2015, 6, 13, 23, 59))# Plot up ceilometer backscatter using HomeyerRainbow CVD friendly colormap
# The same could be done with keyword 'cmap='HomeyerRainbow'
display = act.plotting.TimeSeriesDisplay(ceil_ds, subplot_shape=(1,), figsize=(15, 5))
my_ax = display.axes[0]
display.plot('backscatter', subplot_index=(0,), cvd_friendly=True)
display.time_height_scatter('first_cbh', subplot_index=(0,))#, cmap=None)
display.set_xrng(xrng=time_rng, subplot_index=(0,))
my_ax.axvline(x=datetime.datetime(2015, 6, 13, 22, 34, 21), color='white', linestyle='--', linewidth=2.5, label='Aircraft overpass 22:34:21 UTC')
my_ax.legend(loc='upper left',fontsize=16)
plt.savefig('/data/home/acresanti/arms-race/nsaceil20150613.png')
plt.show()/opt/conda/lib/python3.11/site-packages/dask/_task_spec.py:764: RuntimeWarning: invalid value encountered in log10
return self.func(*new_argspec)
#ceil_ds#print(ceil_ds['time'])# Set time range
#time_rng=(datetime.datetime(2015, 6, 10, 0, 0), datetime.datetime(2015, 6, 10, 23, 59))# # Plot up ceilometer backscatter using HomeyerRainbow CVD friendly colormap
# # The same could be done with keyword 'cmap='HomeyerRainbow'
# display = act.plotting.TimeSeriesDisplay(ceil_ds, subplot_shape=(1,), figsize=(15, 5))
# my_ax = display.axes[0]
# display.plot('backscatter', subplot_index=(0,), cvd_friendly=True, time_rng=time_rng)
# #display.time_height_scatter('first_cbh', subplot_index=(0,))#, cmap=None)
# #display.set_xrng(xrng=time_rng, subplot_index=(0,))
# #my_ax.axvline(x=datetime.datetime(2015, 4, 13, 22, 34, 21), color='white', linestyle='--', linewidth=2.5, label='Aircraft overpass 22:34:21 UTC')
# #my_ax.legend(loc='upper left',fontsize=16)
# #plt.savefig('/data/home/acresanti/arms-race/nsaceil20150613.png')
# plt.show()Plot without ACT
backscatter.shape(5400, 252)len(time)5400len(height)252# Plot up ceilometer backscatter using HomeyerRainbow CVD friendly colormap
time = ceil_ds['time']
height = ceil_ds['range']
backscatter = ceil_ds['backscatter']
Y,X = np.meshgrid(height, time)
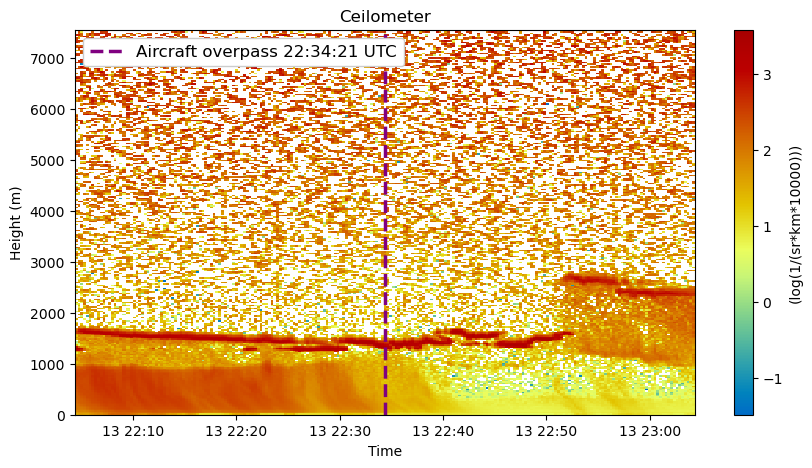
fig, ax = plt.subplots(figsize=(10, 5))
mesh = ax.pcolormesh(X, Y, backscatter, cmap='HomeyerRainbow')
ax.set_xlabel('Time')
ax.set_ylabel('Height (m)')
ax.set_xlim(datetime.datetime(2015, 6, 13, 22, 4, 21), datetime.datetime(2015, 6, 13, 23, 4, 21))
ax.set_title('Ceilometer')
ax.axvline(x=datetime.datetime(2015, 6, 13, 22, 34, 21), color='purple', linestyle='--', linewidth=2.5, label='Aircraft overpass 22:34:21 UTC')
ax.legend(loc='upper left',fontsize=12,framealpha=1)
plt.colorbar(mesh, ax=ax, label="(log(1/(sr*km*10000)))")
plt.show()/opt/conda/lib/python3.11/site-packages/dask/_task_spec.py:764: RuntimeWarning: invalid value encountered in log10
return self.func(*new_argspec)
Create training data
ceil_train = ceil_ds.sel(time=slice('2015-06-10', '2015-06-10'))ceil_trainLoading...
print(ceil_train['range'])<xarray.DataArray 'range' (range: 252)> Size: 1kB
array([ 15., 45., 75., ..., 7485., 7515., 7545.], dtype=float32)
Coordinates:
* range (range) float32 1kB 15.0 45.0 75.0 ... 7.515e+03 7.545e+03
Attributes:
long_name: Distance to the center of the corresponding range bin
units: m
bounds: range_bounds
heights = np.array(ceil_train['range'])heightsarray([ 15., 45., 75., 105., 135., 165., 195., 225., 255.,
285., 315., 345., 375., 405., 435., 465., 495., 525.,
555., 585., 615., 645., 675., 705., 735., 765., 795.,
825., 855., 885., 915., 945., 975., 1005., 1035., 1065.,
1095., 1125., 1155., 1185., 1215., 1245., 1275., 1305., 1335.,
1365., 1395., 1425., 1455., 1485., 1515., 1545., 1575., 1605.,
1635., 1665., 1695., 1725., 1755., 1785., 1815., 1845., 1875.,
1905., 1935., 1965., 1995., 2025., 2055., 2085., 2115., 2145.,
2175., 2205., 2235., 2265., 2295., 2325., 2355., 2385., 2415.,
2445., 2475., 2505., 2535., 2565., 2595., 2625., 2655., 2685.,
2715., 2745., 2775., 2805., 2835., 2865., 2895., 2925., 2955.,
2985., 3015., 3045., 3075., 3105., 3135., 3165., 3195., 3225.,
3255., 3285., 3315., 3345., 3375., 3405., 3435., 3465., 3495.,
3525., 3555., 3585., 3615., 3645., 3675., 3705., 3735., 3765.,
3795., 3825., 3855., 3885., 3915., 3945., 3975., 4005., 4035.,
4065., 4095., 4125., 4155., 4185., 4215., 4245., 4275., 4305.,
4335., 4365., 4395., 4425., 4455., 4485., 4515., 4545., 4575.,
4605., 4635., 4665., 4695., 4725., 4755., 4785., 4815., 4845.,
4875., 4905., 4935., 4965., 4995., 5025., 5055., 5085., 5115.,
5145., 5175., 5205., 5235., 5265., 5295., 5325., 5355., 5385.,
5415., 5445., 5475., 5505., 5535., 5565., 5595., 5625., 5655.,
5685., 5715., 5745., 5775., 5805., 5835., 5865., 5895., 5925.,
5955., 5985., 6015., 6045., 6075., 6105., 6135., 6165., 6195.,
6225., 6255., 6285., 6315., 6345., 6375., 6405., 6435., 6465.,
6495., 6525., 6555., 6585., 6615., 6645., 6675., 6705., 6735.,
6765., 6795., 6825., 6855., 6885., 6915., 6945., 6975., 7005.,
7035., 7065., 7095., 7125., 7155., 7185., 7215., 7245., 7275.,
7305., 7335., 7365., 7395., 7425., 7455., 7485., 7515., 7545.],
dtype=float32)len(heights)252ceil_backscatter = np.array(ceil_train['backscatter'])/opt/conda/lib/python3.11/site-packages/dask/_task_spec.py:764: RuntimeWarning: invalid value encountered in log10
return self.func(*new_argspec)
print(ceil_backscatter.shape)(5400, 252)
time = np.array(ceil_train['time'])print(time)['2015-06-10T00:00:08.000000000' '2015-06-10T00:00:24.000000000'
'2015-06-10T00:00:40.000000000' ... '2015-06-10T23:59:17.000000000'
'2015-06-10T23:59:33.000000000' '2015-06-10T23:59:49.000000000']
len(time)5400import xarray as xr
import numpy as np
# Save as netcdf
ds_ceil_save = xr.Dataset(
data_vars={"backscatter": (["time", "height"], ceil_backscatter)},
coords={"time": time, "height": heights},
attrs={"description": "Backscatter from ceilometer"}
)
#ds_ceil_save.to_netcdf("ceilometer10June2015.nc")ds_ceil_saveLoading...
Create validation data
# Read data
ceil_ds = act.io.arm.read_arm_netcdf(result_ceil)

# Adjust ceilometer data for plotting
ceil_ds = act.corrections.ceil.correct_ceil(ceil_ds, -9999.0)
ERROR 1: PROJ: proj_create_from_database: Open of /opt/conda/share/proj failed
ceil_interest = ceil_dsheights = np.array(ceil_interest['range'])
time = np.array(ceil_interest['time'])
ceil_backscatter = np.array(ceil_interest['backscatter'])
import xarray as xr
import numpy as np
# Save as netcdf
ds_ceil_save = xr.Dataset(
data_vars={"backscatter": (["time", "height"], ceil_backscatter)},
coords={"time": time, "height": heights},
attrs={"description": "Backscatter from ceilometer"}
)
ds_ceil_save.to_netcdf("ceilometer13June2015.nc")/opt/conda/lib/python3.11/site-packages/dask/_task_spec.py:764: RuntimeWarning: invalid value encountered in log10
return self.func(*new_argspec)