import act
import numpy as np
import xarray as xr
import matplotlib.pyplot as plt
import matplotlib.colors as colors
# Set your username and token here!
username = 'nsubhash'
token = 'token-nsubhash2'
# Set the datastream and start/enddates
datastream = 'bnfmetS30.b1'
startdate = '2025-04-01T00:00:00'
enddate = '2025-04-30T23:59:59'
# Use ACT to easily download the data. Watch for the data citation! Show some support
# for ARM's instrument experts and cite their data if you use it in a publication
result_met = act.discovery.download_arm_data(username, token, datastream, startdate, enddate)
#datastream = 'bnfaossmpsM1.b1'
#result_smps = act.discovery.download_arm_data(username, token, datastream, startdate, enddate)[DOWNLOADING] bnfmetS30.b1.20250415.000000.cdf
[DOWNLOADING] bnfmetS30.b1.20250428.000000.cdf
[DOWNLOADING] bnfmetS30.b1.20250427.000000.cdf
[DOWNLOADING] bnfmetS30.b1.20250414.000000.cdf
[DOWNLOADING] bnfmetS30.b1.20250418.000000.cdf
[DOWNLOADING] bnfmetS30.b1.20250405.000000.cdf
[DOWNLOADING] bnfmetS30.b1.20250426.000000.cdf
[DOWNLOADING] bnfmetS30.b1.20250402.000000.cdf
[DOWNLOADING] bnfmetS30.b1.20250412.000000.cdf
[DOWNLOADING] bnfmetS30.b1.20250421.000000.cdf
[DOWNLOADING] bnfmetS30.b1.20250407.000000.cdf
[DOWNLOADING] bnfmetS30.b1.20250419.000000.cdf
[DOWNLOADING] bnfmetS30.b1.20250409.000000.cdf
[DOWNLOADING] bnfmetS30.b1.20250403.000000.cdf
[DOWNLOADING] bnfmetS30.b1.20250406.000000.cdf
[DOWNLOADING] bnfmetS30.b1.20250429.000000.cdf
[DOWNLOADING] bnfmetS30.b1.20250425.000000.cdf
[DOWNLOADING] bnfmetS30.b1.20250411.000000.cdf
[DOWNLOADING] bnfmetS30.b1.20250410.000000.cdf
[DOWNLOADING] bnfmetS30.b1.20250430.000000.cdf
[DOWNLOADING] bnfmetS30.b1.20250401.000000.cdf
[DOWNLOADING] bnfmetS30.b1.20250417.000000.cdf
[DOWNLOADING] bnfmetS30.b1.20250423.000000.cdf
[DOWNLOADING] bnfmetS30.b1.20250420.000000.cdf
[DOWNLOADING] bnfmetS30.b1.20250404.000000.cdf
[DOWNLOADING] bnfmetS30.b1.20250422.000000.cdf
[DOWNLOADING] bnfmetS30.b1.20250413.000000.cdf
[DOWNLOADING] bnfmetS30.b1.20250424.000000.cdf
[DOWNLOADING] bnfmetS30.b1.20250408.000000.cdf
[DOWNLOADING] bnfmetS30.b1.20250416.000000.cdf
If you use these data to prepare a publication, please cite:
Kyrouac, J., Shi, Y., & Tuftedal, M. Surface Meteorological Instrumentation
(MET), 2025-04-01 to 2025-04-30, Bankhead National Forest, AL, USA; Long-term
Mobile Facility (BNF), Bankhead National Forest, AL, Supplemental facility at
Falkville (S30). Atmospheric Radiation Measurement (ARM) User Facility.
https://doi.org/10.5439/1786358
ds_met = act.io.read_arm_netcdf(result_met)
ds_met
ERROR 1: PROJ: proj_create_from_database: Open of /opt/conda/share/proj failed
Loading...
display = act.plotting.TimeSeriesDisplay({'MET': ds_met}, figsize=(15, 10), subplot_shape=(2,))

display.plot('temp_mean', dsname='MET', subplot_index=(0,))
display.plot('rh_mean', dsname='MET', subplot_index=(1,))


# ax2 = display.axes[1].twinx()
# ax2.plot(ds_met.time, ds_met.time, color='orange')

# Plot up a day/night background
display.day_night_background(dsname='MET', subplot_index=(1,))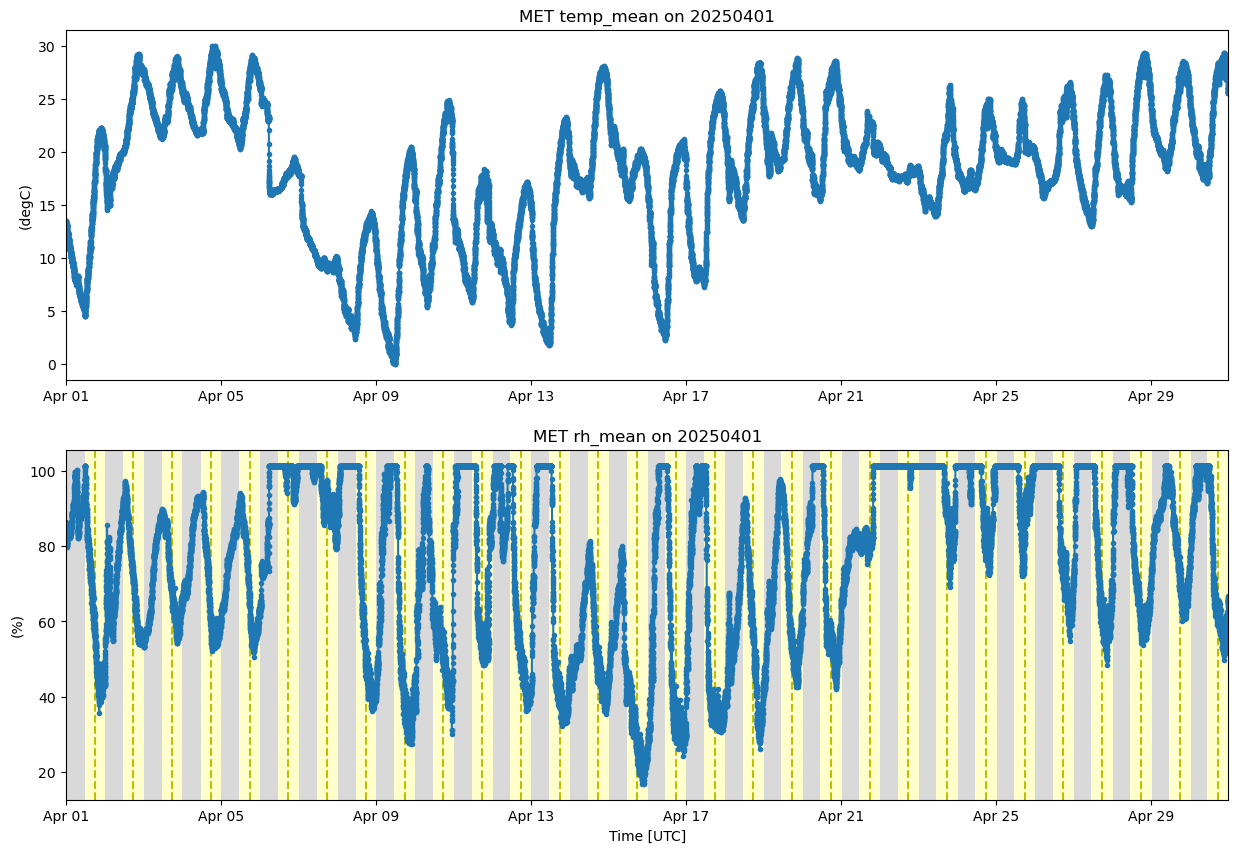
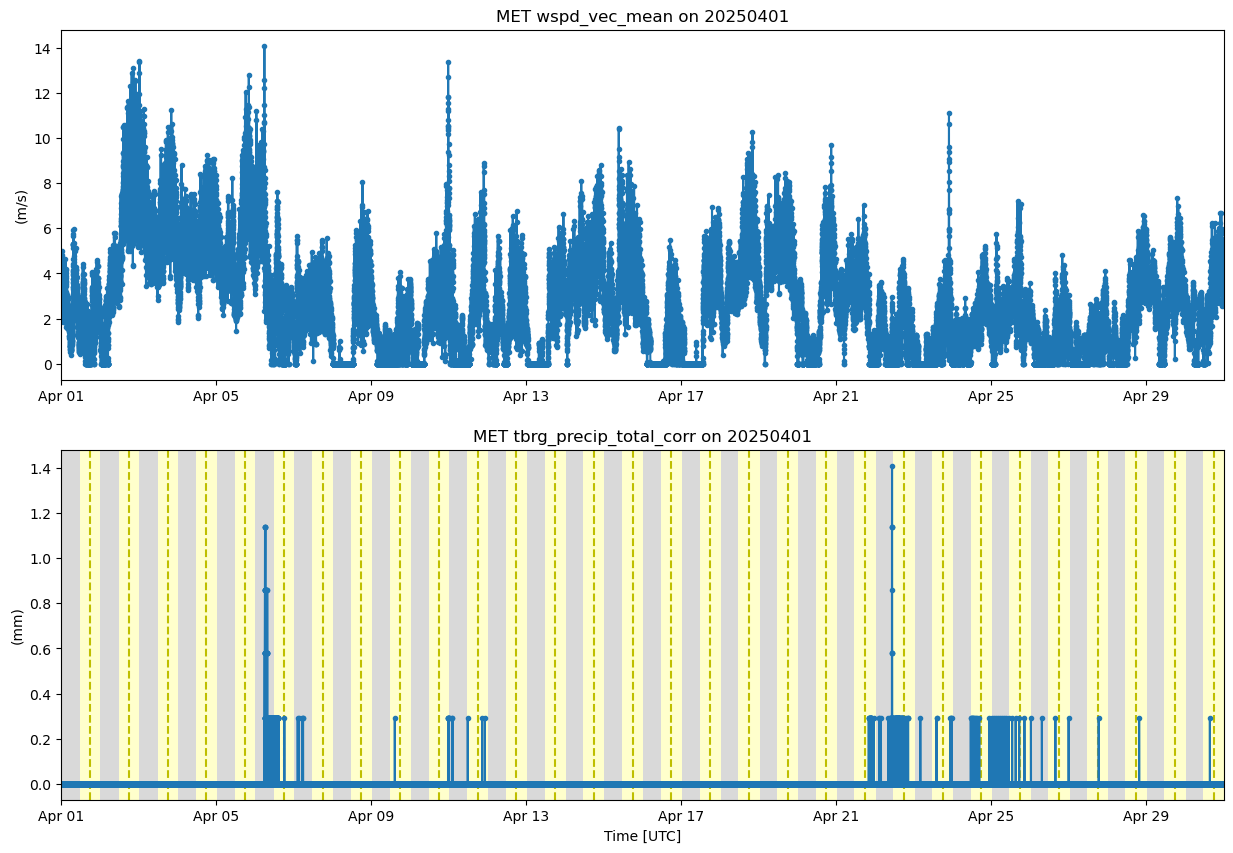
display = act.plotting.TimeSeriesDisplay({'MET': ds_met}, figsize=(15, 10), subplot_shape=(2,))


display.plot('wspd_vec_mean', dsname='MET', subplot_index=(0,))
display.plot('tbrg_precip_total_corr', dsname='MET', subplot_index=(1,))

# ax2 = display.axes[1].twinx()
# ax2.plot(ds_met.time, ds_met.time, color='orange')

# Plot up a day/night background
display.day_night_background(dsname='MET', subplot_index=(1,))