Imports
Let’s get started with some data! But first, we need to import some libraries.
import act
import numpy as np
import xarray as xr
import matplotlib.pyplot as plt
import matplotlib.colors as colors
Downloading and Reading ARM’s NetCDF Data
ARM’s standard file format is NetCDF (network Common Data Form) which makes it very easy to work with in Python! ARM data are available through a data portal called Data Discovery or through a webservice. If you didn’t get your username and token earlier, please go back and see the Prerequisites!
Let’s download some of the MET data first!
# Set your username and token here!
username = 'sanielson'
token = 'xxxxxx'

# Set the datastream and start/enddates
datastream = 'bnfstampS20.b1'
startdate = '2025-03-31'
enddate = '2025-04-30T23:59:59'

# Use ACT to easily download the data.  Watch for the data citation!  Show some support
# for ARM's instrument experts and cite their data if you use it in a publication
result_stamp = act.discovery.download_arm_data(username, token, datastream, startdate, enddate)

# datastream = 'bnfaossmpsM1.b1'
# result_smps = act.discovery.download_arm_data(username, token, datastream, startdate, enddate)
[DOWNLOADING] bnfstampS20.b1.20250405.000000.nc
[DOWNLOADING] bnfstampS20.b1.20250428.000000.nc
[DOWNLOADING] bnfstampS20.b1.20250415.000000.nc
[DOWNLOADING] bnfstampS20.b1.20250430.000000.nc
[DOWNLOADING] bnfstampS20.b1.20250426.000000.nc
[DOWNLOADING] bnfstampS20.b1.20250425.000000.nc
[DOWNLOADING] bnfstampS20.b1.20250414.000000.nc
[DOWNLOADING] bnfstampS20.b1.20250402.000000.nc
[DOWNLOADING] bnfstampS20.b1.20250331.000000.nc
[DOWNLOADING] bnfstampS20.b1.20250429.000000.nc
[DOWNLOADING] bnfstampS20.b1.20250423.000000.nc
[DOWNLOADING] bnfstampS20.b1.20250410.000000.nc
[DOWNLOADING] bnfstampS20.b1.20250412.000000.nc
[DOWNLOADING] bnfstampS20.b1.20250418.000000.nc
[DOWNLOADING] bnfstampS20.b1.20250419.000000.nc
[DOWNLOADING] bnfstampS20.b1.20250407.000000.nc
[DOWNLOADING] bnfstampS20.b1.20250401.000000.nc
[DOWNLOADING] bnfstampS20.b1.20250404.000000.nc
[DOWNLOADING] bnfstampS20.b1.20250406.000000.nc
[DOWNLOADING] bnfstampS20.b1.20250427.000000.nc
[DOWNLOADING] bnfstampS20.b1.20250413.000000.nc
[DOWNLOADING] bnfstampS20.b1.20250417.000000.nc
[DOWNLOADING] bnfstampS20.b1.20250422.000000.nc
[DOWNLOADING] bnfstampS20.b1.20250420.000000.nc
[DOWNLOADING] bnfstampS20.b1.20250408.000000.nc
[DOWNLOADING] bnfstampS20.b1.20250403.000000.nc
[DOWNLOADING] bnfstampS20.b1.20250421.000000.nc
[DOWNLOADING] bnfstampS20.b1.20250416.000000.nc
[DOWNLOADING] bnfstampS20.b1.20250409.000000.nc
[DOWNLOADING] bnfstampS20.b1.20250424.000000.nc
[DOWNLOADING] bnfstampS20.b1.20250411.000000.nc
If you use these data to prepare a publication, please cite:
Kyrouac, J., Cook, D., Ermold, B., Pal, S., Sullivan, R., & Keeler, E. Soil
Temperature and Moisture Profiles (STAMP), 2025-03-31 to 2025-04-30, Bankhead
National Forest, AL, USA; Long-term Mobile Facility (BNF), Bankhead National
Forest, AL, Supplemental facility at Courtland (S20). Atmospheric Radiation
Measurement (ARM) User Facility. https://doi.org/10.5439/1238260
Note: Did you notice the citation and DOI?
# Let's read in the data using ACT and check out the data
ds_stamp = act.io.read_arm_netcdf(result_stamp)
#ds_smps = act.io.read_arm_netcdf(result_smps)

ds_stamp
ERROR 1: PROJ: proj_create_from_database: Open of /opt/conda/share/proj failed
Loading...
Soil sensors at 1 depth
#this will plot each of the three soil sensors (east, west and south) at one depth
ds_stamp.clean.cleanup()

ds1=ds_stamp.sel(depth=5)  #pick depth here

# Query the ARM DQR Webservice
south_temp = 'soil_temperature_south'
west_temp = 'soil_temperature_west'
east_temp = 'soil_temperature_east'

south_wc = 'soil_specific_water_content_south'
west_wc = 'soil_specific_water_content_west'
east_wc = 'soil_specific_water_content_east'

display = act.plotting.TimeSeriesDisplay(ds1, figsize=(15, 10), subplot_shape=(2,))

# Plot up the variable in the first plot
display.plot(south_temp, subplot_index=(0,), label='South Temp')
display.plot(west_temp, subplot_index=(0,), label='West Temp')
display.plot(east_temp, subplot_index=(0,), label='East Temp')
display.day_night_background(subplot_index=(0,))
display.axes[0].legend()

display.plot(south_wc, subplot_index=(1,), label='South WC')
display.plot(west_wc, subplot_index=(1,), label='West WC')
display.plot(east_wc, subplot_index=(1,), label='East WC')
display.day_night_background(subplot_index=(1,))
display.axes[1].legend()

plt.show()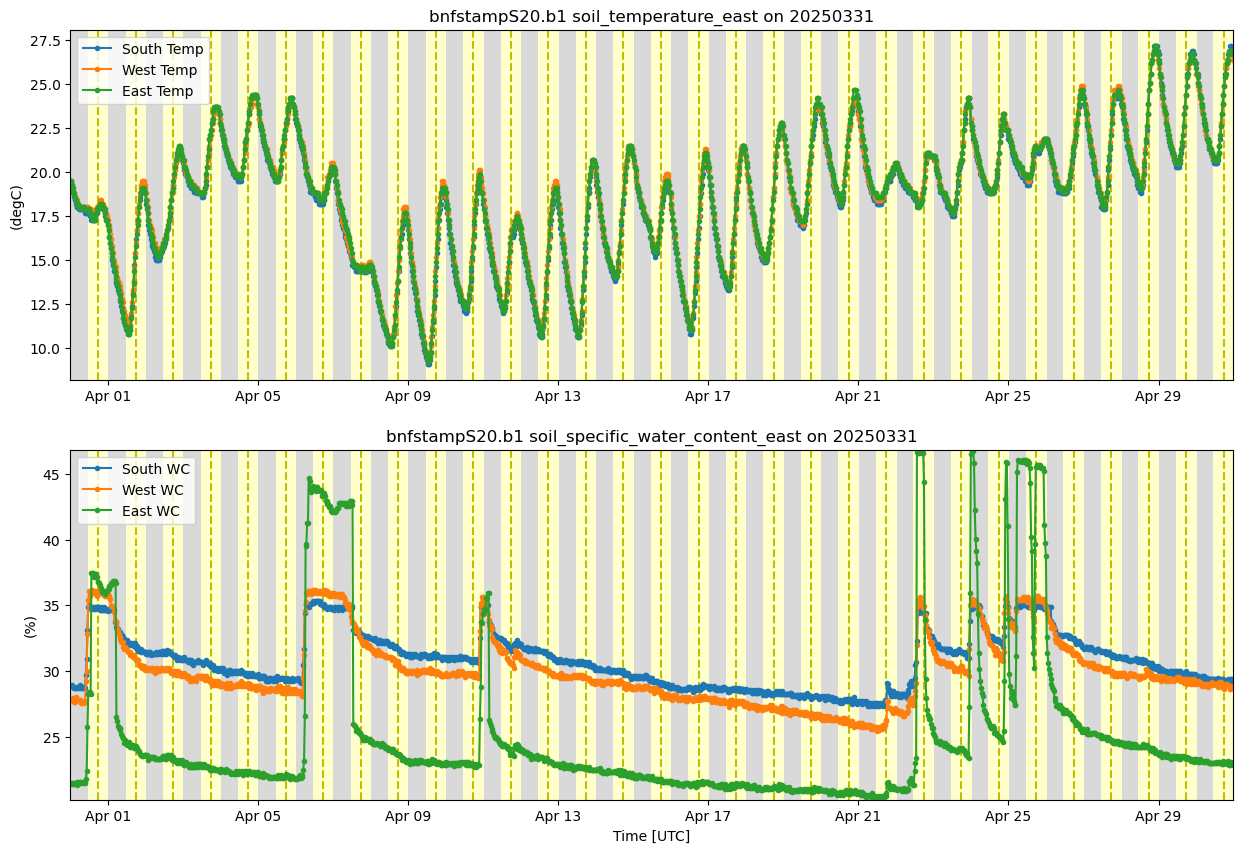
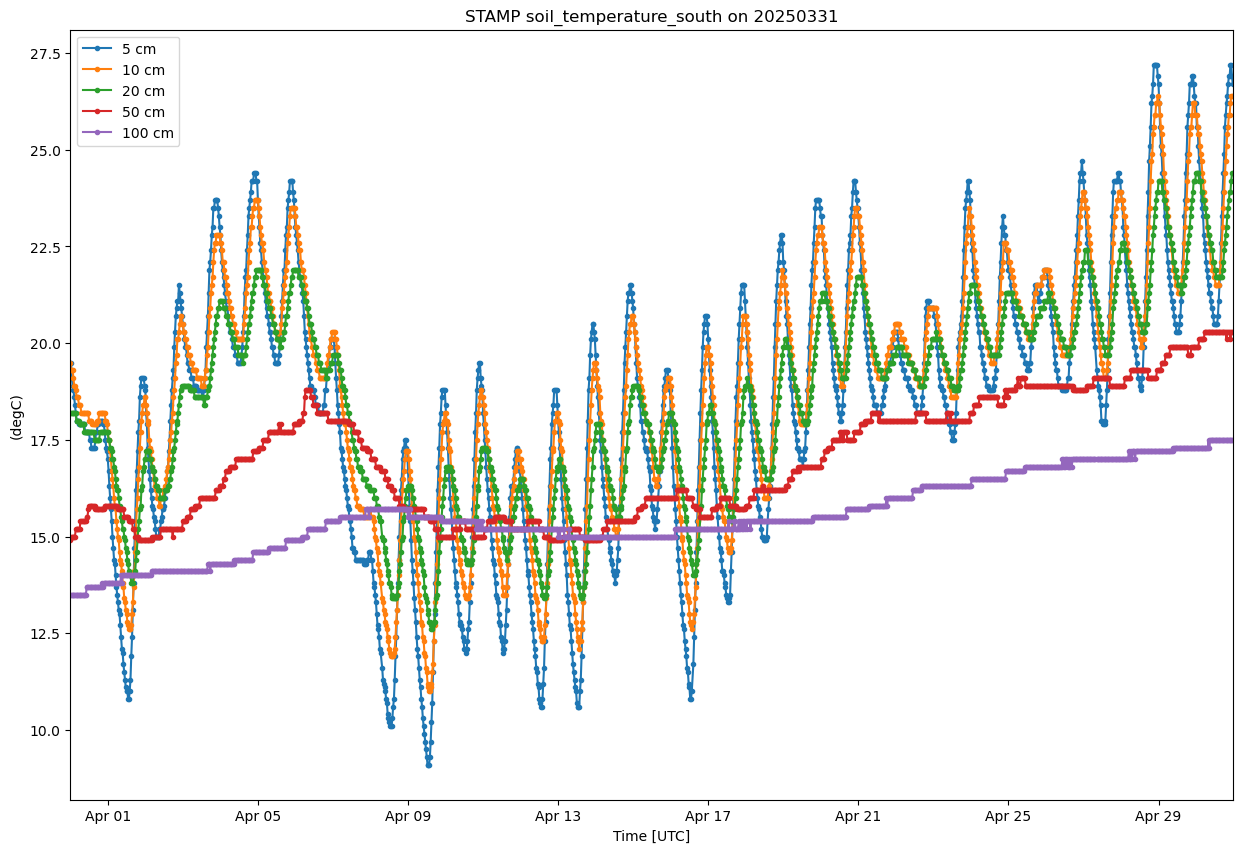
One Sensor at 5 Depths
#this will plot one sensor (east, west or south) for all 5 depths for the time range

display = act.plotting.TimeSeriesDisplay({'STAMP': ds_stamp}, figsize=(15, 10), subplot_shape=(1,))
display.plot('soil_temperature_south', dsname='STAMP', subplot_index=(0,), force_line_plot=True, labels = True)
<Axes: title={'center': 'STAMP soil_temperature_south on 20250331'}, xlabel='Time [UTC]', ylabel='(degC)'>