Here, we test another application of the tobac package for tracking Brightness Temperature from GOES-East Mesoscale Sector - Channel 13
import datetime
import shutil
from pathlib import Path
from six.moves import urllib

import numpy as np
import pandas as pd
import xarray as xr

import matplotlib.pyplot as plt
%matplotlib inline

import glob
import cmweather

import tobac
ERROR 1: PROJ: proj_create_from_database: Open of /opt/conda/share/proj failed
files = sorted(glob.glob("/data/project/ARM_Summer_School_2025/bnf/goes_b13/output/20250520/*"))
files
ds = xr.open_dataset("/data/project/ARM_Summer_School_2025/bnf/goes_b13/output/20250520/GOES19_B13_BT_20250520_200155Z.nc")
dsLoading...
import pandas as pdf"20250520{ds.source_file[-10:-6]}"'202505202002'#ds.add_coords()def add_time(ds):
time_string = ds.source_file[-10:-6]
if int(time_string) < 500:
start_date = "20250521"
else:
start_date = "20250520"
ds["time"] = pd.to_datetime(f"{start_date}{time_string}", format="%Y%m%d%H%M")
ds = ds.set_coords(["time"])
return dsds.brightness_temperature.plot()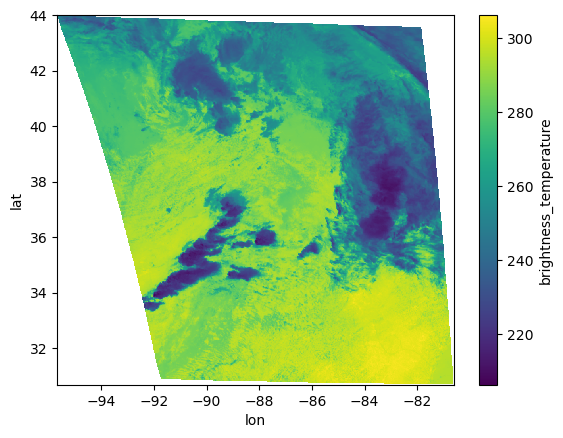
files = sorted(glob.glob("/data/project/ARM_Summer_School_2025/bnf/goes_b13/output/20250520/*"))ds = xr.open_mfdataset(files,
preprocess=add_time,
combine = 'nested',
concat_dim="time")dsLoading...
ds["brightness_temperature"].isel(time=-1).plot()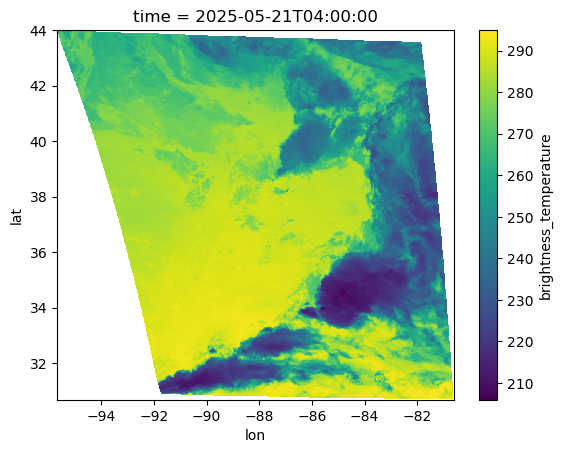
BT = ds.brightness_temperaturedxy = 500dt = 60# Keyword arguments for the feature detection step
parameters_features={}
parameters_features['position_threshold']='weighted_diff'
parameters_features['sigma_threshold']=0.5
parameters_features['n_min_threshold']=4
parameters_features['target']='minimum'
parameters_features['threshold']=[220,210,200,190]# Feature detection and save results to file:
print('starting feature detection')
Features=tobac.feature_detection_multithreshold(BT,dxy,**parameters_features)
print('feature detection performed and saved')starting feature detection
feature detection performed and saved
# keyword arguments for linking step
parameters_linking={}
parameters_linking['v_max']=20
parameters_linking['stubs']=2
parameters_linking['order']=1
parameters_linking['extrapolate']=0
parameters_linking['memory']=0
parameters_linking['adaptive_stop']=0.2
parameters_linking['adaptive_step']=0.95
parameters_linking['subnetwork_size']=100
parameters_linking['method_linking']= 'predict'
# Perform linking and save results to file:
Track=tobac.linking_trackpy(Features,BT,dt=dt,dxy=dxy,**parameters_linking)Frame 479: 25 trajectories present.
ds.brightness_temperature.min().compute()Loading...
timeseries = ds.min(dim=["lon", "lat"]).compute()
timeseries
Loading...
#timeseries.brightness_temperature.plot()plt.plot(timeseries.brightness_temperature)
plt.title("Time series")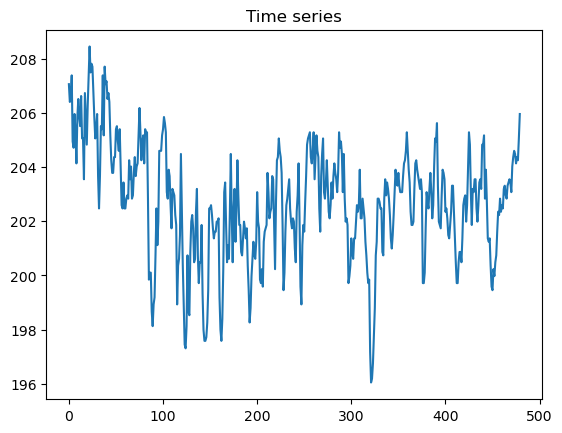
Features.loc[Features.threshold_value == 200]Loading...
Track.loc[Track.threshold_value == 200]Loading...
single_cell_df = Track.loc[Track.cell == 594]
single_cell_df
Loading...
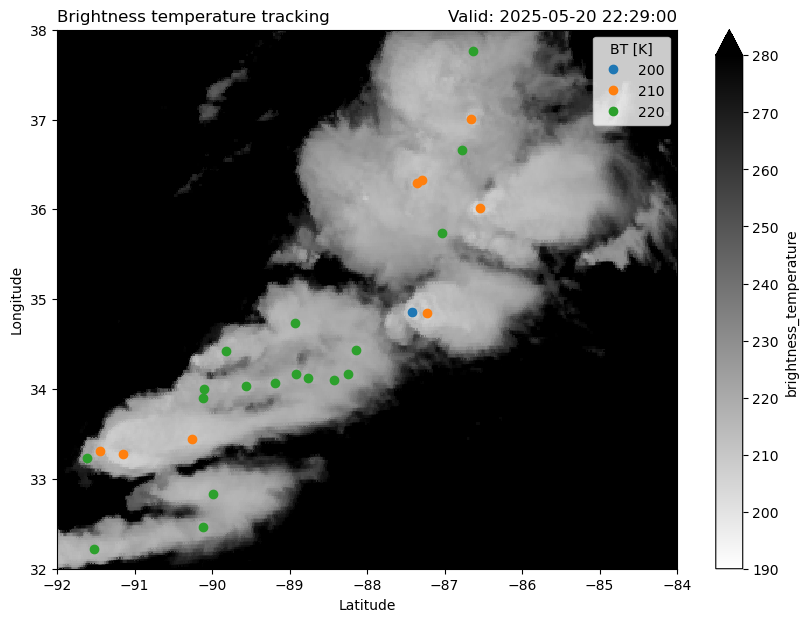
frame=145
plt.figure(figsize=(10, 7))
BT[frame].plot(cmap="binary", vmin=190, vmax=280)
points = {
    threshold:plt.plot(ft.lon, ft.lat, "o")[0]
    for threshold, ft in Features[Features.frame==frame].groupby("threshold_value")
}
plt.legend(list(points.values()), list(points.keys()), title="BT [K]")
plt.title("Brightness temperature tracking", loc='left')
plt.title(f'Valid: {time}', loc='right')
plt.title("", loc='center')
plt.ylim(32, 38)
plt.xlim(-92, -84)
plt.ylabel("Longitude")
plt.xlabel("Latitude")
plt.savefig("cloud-top-temps.png", dpi=300)
/tmp/ipykernel_1754/147940783.py:16: UserWarning: Creating legend with loc="best" can be slow with large amounts of data.
plt.savefig("cloud-top-temps.png", dpi=300)
dsLoading...
timeseries_ds_list = []
for time in single_cell_df.time:
    subset = single_cell_df.loc[single_cell_df.time == time]
    timeseries_ds_list.append(ds.sel(time=subset.time.values,
                                     lat=subset.lat.values,
                                     lon=subset.lon.values,
                                     method='nearest').squeeze())
single_cell_ds = xr.concat(timeseries_ds_list, dim="time")
single_cell_ds
Loading...
single_cell_ds.brightness_temperature.plot()
plt.title("Time series of brightness temperature for coldest cell")
plt.ylabel("Brightness temperature (K)")
plt.xlabel("Time")
plt.savefig("cloud-top-temps-timeseries.png", dpi=300)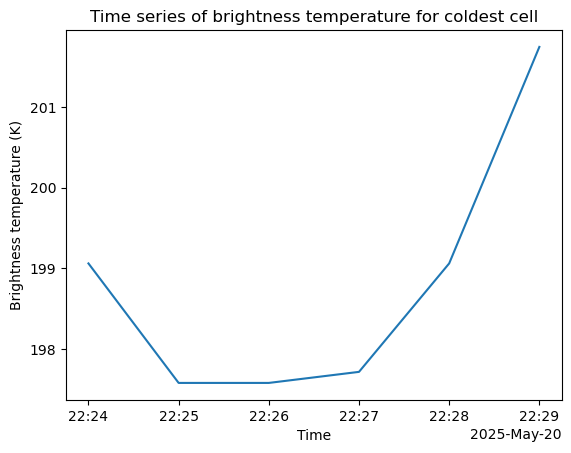
# Keyword arguments for the feature detection step
#parameters_features={}
#parameters_features['position_threshold']='weighted_diff'
#parameters_features['sigma_threshold']=0.5
#parameters_features['n_min_threshold']=10
#parameters_features['target']='minimum'
#parameters_features['threshold']=[220,210,200,190]

# Feature detection and save results to file:
#print('starting feature detection')
#Features=tobac.feature_detection_multithreshold(BT,dxy,**parameters_features)
#print('feature detection performed and saved')

# keyword arguments for linking step
#parameters_linking={}
#parameters_linking['v_max']=20
#parameters_linking['stubs']=2
#parameters_linking['order']=1
#parameters_linking['extrapolate']=0
#parameters_linking['memory']=0
#parameters_linking['adaptive_stop']=0.2
#parameters_linking['adaptive_step']=0.95
#parameters_linking['subnetwork_size']=100
#parameters_linking['method_linking']= 'predict'

# Perform linking and save results to file:
#Track=tobac.linking_trackpy(Features,BT,dt=dt,dxy=dxy,**parameters_linking)
#frame=145
#BT[frame].plot(cmap="binary")
#points = {
# threshold:plt.plot(ft.lon, ft.lat, "o")[0]
# for threshold, ft in Features[Features.frame==frame].groupby("threshold_value")
#}
#plt.legend(list(points.values()), list(points.keys()), title="BT [K]")