import act
import pyart
import metpy
from metpy.units import units
import numpy as np
import xarray as xr
import matplotlib.pyplot as plt
import matplotlib.colors as colors
import glob
May 20 Event
# this is pulling individual May 20 C-SAPR2 radar data
csacr = "/data/project/ARM_Summer_School_2025/bnf/bnfcsapr2cfrS3.a1/bnfcsapr2cfrS3.a1.20250520.233012.nc"
ds_csacr = xr.open_dataset(csacr)
ds_csacrbelow is radiosonde data, but I’m not sure I need it anymore
# # pull in met data using ACT
# # Set your username and token here!
# username = 'abchui'
# token = '3279f3ac6800743d'

# # Set the datastream and start/enddates
# datastream = 'bnfsondewnpnM1.b1'
# startdate = '2025-05-20T23:00:00'
# enddate = '2025-05-20T23:59:59'

# # Use ACT to easily download the data.  Watch for the data citation!  Show some support
# # for ARM's instrument experts and cite their data if you use it in a publication
# result_sonde = act.discovery.download_arm_data(username, token, datastream, startdate, enddate)

# sonde = pyart.io.read_arm_sonde("/data/project/ARM_Summer_School_2025/bnf/bnfsondewnpnM1.b1/bnfsondewnpnM1.b1.20250520.233000.cdf")
pull MET data and then MAWS data for the dewpoint temperature (MET doesn’t have dewpoint) in order to calculate theta-e using metpy
# pull in met data using ACT
# Set your username and token here!
username = 'abchui'
token = '3279f3ac6800743d'

# Set the datastream and start/enddates
datastream = 'bnfmetM1.b1'
startdate = '2025-05-20'
enddate = '2025-05-21T23:59:59' #notice can give date and time or leave it blank (like with start date)

# Use ACT to easily download the data.  Watch for the data citation!  Show some support
# for ARM's instrument experts and cite their data if you use it in a publication
result_met = act.discovery.download_arm_data(username, token, datastream, startdate, enddate)
ds_met = act.io.read_arm_netcdf(result_met)
ds_metcalculate theta-e, a good indicator for a cold pool
# thetae = metpy.calc.equivalent_potential_temperature(ds_met.atmos_pressure, ds_met.temp_mean, ds_met.dewpoint)# # Create a plotting display object with 2 plots - do I want
# display = act.plotting.TimeSeriesDisplay(ds_met, figsize=(15, 10), subplot_shape=(2,))
# # Plot up the MET btemperature and precipitation
# display.plot('temp_mean', subplot_index=(1,))
# ax2 = display.axes[1].twinx() #copies the x axis onto both plots
# ax2.plot(ds_met.time, ds_met.tbrg_precip_total, color='orange')
# # Plot up a day/night background
# display.day_night_background(subplot_index=(1,))
# plt.show()March 15
# C-SACR data
csacr = sorted(glob.glob("/data/project/ARM_Summer_School_2025/bnf/bnfcsapr2cfrS3.a1/bnfcsapr2cfrS3.a1.20250315.233012.nc"))
May 1
pull kazr2 general mode data. Can use ACT for this because KAZR (RHI type) radar is not super huge file. The cone type ones (like SACR) are very large files and so would prefer to just pull individual files for those.
# Set your username and token here!
username = 'abchui'
token = '3279f3ac6800743d'

# Set the datastream and start/enddates
datastream = 'bnfkazr2cfrgeM1.a1'
startdate = '2025-05-01'
enddate = '2025-05-01T23:59:59' #notice can give date and time or leave it blank (like with start date)

# Use ACT to easily download the data.  Watch for the data citation!  Show some support
# for ARM's instrument experts and cite their data if you use it in a publication
result_kazr2 = act.discovery.download_arm_data(username, token, datastream, startdate, enddate)
ds_kazr2 = act.io.read_arm_netcdf(result_kazr2)
[DOWNLOADING] bnfkazr2cfrgeM1.a1.20250501.010001.nc
[DOWNLOADING] bnfkazr2cfrgeM1.a1.20250501.110001.nc
[DOWNLOADING] bnfkazr2cfrgeM1.a1.20250501.080000.nc
[DOWNLOADING] bnfkazr2cfrgeM1.a1.20250501.220001.nc
[DOWNLOADING] bnfkazr2cfrgeM1.a1.20250501.140001.nc
[DOWNLOADING] bnfkazr2cfrgeM1.a1.20250501.150001.nc
[DOWNLOADING] bnfkazr2cfrgeM1.a1.20250501.230001.nc
[DOWNLOADING] bnfkazr2cfrgeM1.a1.20250501.100002.nc
[DOWNLOADING] bnfkazr2cfrgeM1.a1.20250501.120001.nc
[DOWNLOADING] bnfkazr2cfrgeM1.a1.20250501.050000.nc
[DOWNLOADING] bnfkazr2cfrgeM1.a1.20250501.000001.nc
[DOWNLOADING] bnfkazr2cfrgeM1.a1.20250501.030001.nc
[DOWNLOADING] bnfkazr2cfrgeM1.a1.20250501.190000.nc
[DOWNLOADING] bnfkazr2cfrgeM1.a1.20250501.040001.nc
[DOWNLOADING] bnfkazr2cfrgeM1.a1.20250501.210002.nc
[DOWNLOADING] bnfkazr2cfrgeM1.a1.20250501.160000.nc
[DOWNLOADING] bnfkazr2cfrgeM1.a1.20250501.085959.nc
[DOWNLOADING] bnfkazr2cfrgeM1.a1.20250501.020001.nc
[DOWNLOADING] bnfkazr2cfrgeM1.a1.20250501.195959.nc
[DOWNLOADING] bnfkazr2cfrgeM1.a1.20250501.170000.nc
[DOWNLOADING] bnfkazr2cfrgeM1.a1.20250501.130001.nc
[DOWNLOADING] bnfkazr2cfrgeM1.a1.20250501.180000.nc
[DOWNLOADING] bnfkazr2cfrgeM1.a1.20250501.060000.nc
[DOWNLOADING] bnfkazr2cfrgeM1.a1.20250501.070000.nc
If you use these data to prepare a publication, please cite:
Feng, Y.-C., Lindenmaier, I., Matthews, A., Wendler, T., Melo de Castro, V.,
Deng, M., & Rocque, M. Ka ARM Zenith Radar (KAZR2CFRGE), 2025-05-01 to
2025-05-01, Bankhead National Forest, AL, USA; Long-term Mobile Facility (BNF),
Bankhead National Forest, AL, AMF3 (Main Site) (M1). Atmospheric Radiation
Measurement (ARM) User Facility. https://doi.org/10.5439/1891991
pull MET data and then MAWS data for the dewpoint temperature (MET doesn’t have dewpoint) in order to calculate theta-e using metpy
# pull in met data using ACT
# Set your username and token here!
username = 'abchui'
token = '3279f3ac6800743d'

# Set the datastream and start/enddates
datastream = 'bnfmetM1.b1'
startdate = '2025-05-01'
enddate = '2025-05-01T23:59:59' #notice can give date and time or leave it blank (like with start date)

# Use ACT to easily download the data.  Watch for the data citation!  Show some support
# for ARM's instrument experts and cite their data if you use it in a publication
result_met = act.discovery.download_arm_data(username, token, datastream, startdate, enddate)
ds_met = act.io.read_arm_netcdf(result_met)
ds_metdownload Radar Wind Profiler (rwp) data for wind average
# pull in met data using ACT
# Set your username and token here!
username = 'abchui'
token = '3279f3ac6800743d'

# Set the datastream and start/enddates
datastream = 'bnf915rwpwindavgM1.a1'
startdate = '2025-05-01'
enddate = '2025-05-01T23:59:59' #notice can give date and time or leave it blank (like with start date)

# Use ACT to easily download the data.  Watch for the data citation!  Show some support
# for ARM's instrument experts and cite their data if you use it in a publication
result_rwp = act.discovery.download_arm_data(username, token, datastream, startdate, enddate)
ds_rwp = act.io.read_arm_netcdf(result_rwp)
ds_rwpcalculate theta-e, a good indicator of cold pool
# two ways to calculate theta-e: 1) pull maws data dewpoint temp and combine time or 2) calculate dewpoint temp from RH in the met data
# method 2) is better because method 1) will cause loss of resolution

# 1) to calculate theta-e, need met and maws data but by looking at the time from above you can see the time is slightly off, both are 1 min but maws if at 4 sec into the minute
# ds_combined = xr.merge([ds_met.resample(time='1min').nearest(), ds_maws.resample(time='1min').nearest()], compat='override')
# thetae = metpy.calc.equivalent_potential_temperature(ds_combined.atmos_pressure, ds_combined.temp_mean, ds_combined.atmospheric_dew_point)

# 2)
dewpt_temp = metpy.calc.dewpoint_from_relative_humidity(ds_met.temp_mean, ds_met.rh_mean)
thetaeK = metpy.calc.equivalent_potential_temperature(ds_met.atmos_pressure, ds_met.temp_mean, dewpt_temp)
thetaeC = thetaeK - 273.15*units.kelvin
plot the KAZR RHI with the thetae? Or at least the mean temp and the wind barbs from rwp
# Create a plotting display object with 3 plots - do I want
display = act.plotting.TimeSeriesDisplay({'KAZR2': ds_kazr2, 'MET': ds_met, 'RWP' : ds_rwp}, figsize=(15, 15), subplot_shape=(3,))

# top (first) subplot (index of 0)
display.plot('reflectivity', dsname='KAZR2', subplot_index=(0,))

# middle (second) subplot (index of 1)
# Plot up the MET temperature and theta-e (calculated from met mean temp and RH)
display.plot('temp_mean', dsname='MET', subplot_index=(1,))
ax2 = display.axes[1].twinx() #copies the x axis onto both plots
ax2.plot(ds_met.time, thetaeC, color='orange')
ax2.set_ylabel('Equivalent Potential Temperature (degC)')

# bottom (third) subplot (index of 2)
# display.plot_barbs_from_spd_dir('wind_speed', num_barbs_x=20), dsname="RWP", subplot_index=(2,1))

# Plot up a day/night background
display.day_night_background(dsname='MET', subplot_index=(1,))

plt.show()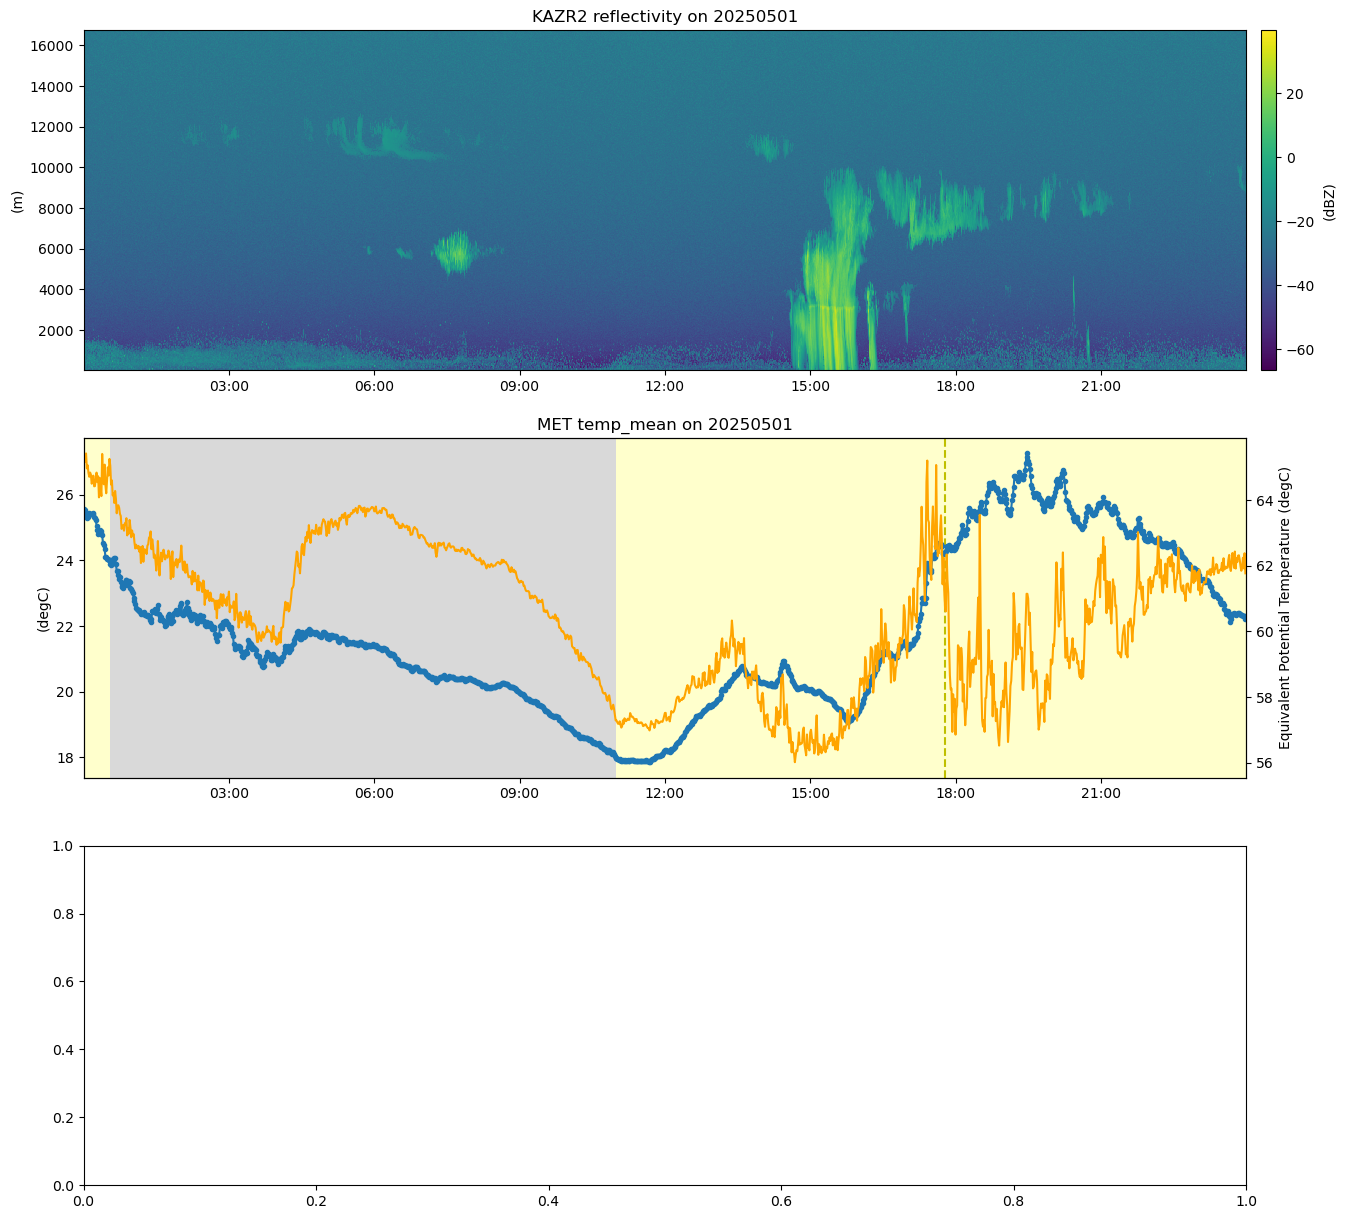
May 12
csacr = sorted(glob.glob("/data/project/ARM_Summer_School_2025/bnf/bnfcsapr2cfrS3.a1/bnfcsapr2cfrS3.a1.20250512.233012.nc"))