import os
import warnings

import cartopy.crs as ccrs
import matplotlib.pyplot as plt
import numpy as np
import xarray as xr

import pyart
from pyart.testing import get_test_data
import xradar as xd

warnings.filterwarnings('ignore')
ERROR 1: PROJ: proj_create_from_database: Open of /opt/conda/share/proj failed
## You are using the Python ARM Radar Toolkit (Py-ART), an open source
## library for working with weather radar data. Py-ART is partly
## supported by the U.S. Department of Energy as part of the Atmospheric
## Radiation Measurement (ARM) Climate Research Facility, an Office of
## Science user facility.
##
## If you use this software to prepare a publication, please cite:
##
##     JJ Helmus and SM Collis, JORS 2016, doi: 10.5334/jors.119
file = "/data/project/ARM_Summer_School_2025/bnf/bnfcsapr2cfrS3.a1/bnfcsapr2cfrS3.a1.20250520.220020.nc"files1 = sorted(glob.glob("/data/project/ARM_Summer_School_2025/bnf/bnfcsapr2cfrS3.a1/bnfcsapr2cfrS3.a1.20250520.22*"))
files2 = sorted(glob.glob("/data/project/ARM_Summer_School_2025/bnf/bnfcsapr2cfrS3.a1/bnfcsapr2cfrS3.a1.20250521.*"))filelist = files1 + files2file[-18:-3]'20250520.220020'outpath = "/data/home/kbritton/bnf-deep-convection/imgs/csapr_ppi/" + file[-18:-3] + '.jpg'radar = pyart.io.read(file)list(radar.fields.keys())['attenuation_corrected_differential_reflectivity',
'attenuation_corrected_differential_reflectivity_lag_1',
'attenuation_corrected_reflectivity_h',
'censor_mask',
'classification_mask',
'copol_correlation_coeff',
'differential_phase',
'differential_reflectivity',
'differential_reflectivity_lag_1',
'mean_doppler_velocity',
'mean_doppler_velocity_v',
'normalized_coherent_power',
'normalized_coherent_power_v',
'reflectivity',
'reflectivity_v',
'signal_to_noise_ratio_copolar_h',
'signal_to_noise_ratio_copolar_v',
'specific_differential_phase',
'spectral_width',
'spectral_width_v',
'uncorrected_copol_correlation_coeff',
'uncorrected_differential_phase',
'uncorrected_differential_reflectivity',
'uncorrected_differential_reflectivity_lag_1',
'uncorrected_mean_doppler_velocity_h',
'uncorrected_mean_doppler_velocity_v',
'uncorrected_reflectivity_h',
'uncorrected_reflectivity_v',
'uncorrected_spectral_width_h',
'uncorrected_spectral_width_v',
'unthresholded_power_copolar_h',
'unthresholded_power_copolar_v']nyquist_velocity = radar.instrument_parameters["nyquist_velocity"]["data"]
nyquist_velocity
nyquist_value = np.unique(nyquist_velocity)[0]vel_texture = pyart.retrieve.calculate_velocity_texture(radar,
vel_field='mean_doppler_velocity',
nyq=nyquist_value)
vel_texture{'units': 'meters_per_second',
'standard_name': 'texture_of_radial_velocity_of_scatters_away_from_instrument',
'long_name': 'Doppler velocity texture',
'coordinates': 'elevation azimuth range',
'data': array([[1.90597636, 4.21606099, 4.61909816, ..., 8.30127196, 7.0220529 ,
7.0220529 ],
[2.02295807, 4.58419983, 4.66314623, ..., 7.91769374, 7.44214105,
7.57185213],
[2.02295807, 4.67402379, 4.67409454, ..., 7.44214105, 7.57185213,
9.14783468],
...,
[0.79154212, 0.6327803 , 0.5373353 , ..., 8.07379239, 8.07379239,
8.0708598 ],
[0.6327803 , 0.61212518, 0.57460472, ..., 9.50789107, 9.50789107,
8.97771087],
[0.57706446, 0.57706446, 0.60757789, ..., 9.84894029, 9.62004369,
9.62004369]])}radar.add_field('texture', vel_texture, replace_existing=True)
fig = plt.figure(figsize=[8, 8])
display = pyart.graph.RadarMapDisplay(radar)
display.plot_ppi_map('texture',
sweep=0,
resolution='50m',
vmin=0,
vmax=10,
projection=ccrs.PlateCarree(),
cmap='balance')
plt.show()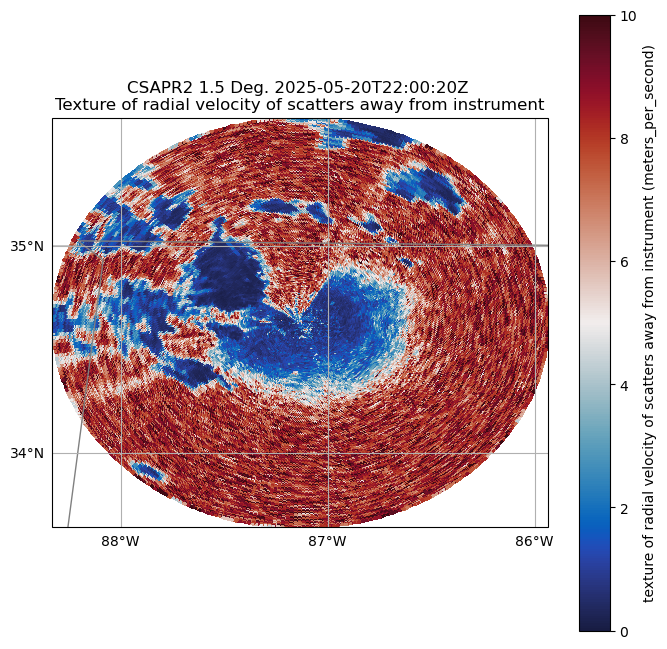
hist, bins = np.histogram(radar.fields['texture']['data'],
                          bins=150, range=(0,10))
bins = (bins[1:]+bins[:-1])/2.0

plt.plot(bins,
         hist,
         label='Velocity Texture Frequency')
plt.axvline(3,
            color='r',
            label='Proposed Velocity Texture Threshold')

plt.xlabel('Velocity texture')
plt.ylabel('Count')
plt.legend()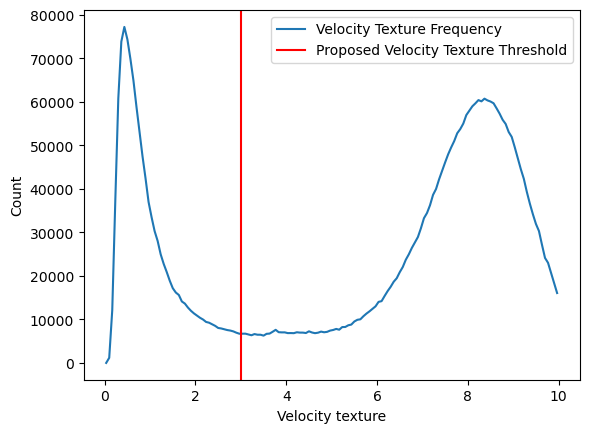
gatefilter = pyart.filters.GateFilter(radar)
gatefilter.exclude_above('texture', 4)
velocity_dealiased = pyart.correct.dealias_region_based(radar,
vel_field='mean_doppler_velocity',
nyquist_vel=nyquist_value,
centered=True,
gatefilter=gatefilter)
# Add our data dictionary to the radar object
radar.add_field('corrected_velocity', velocity_dealiased, replace_existing=True)fig = plt.figure(figsize=[8, 8])
display = pyart.graph.RadarMapDisplay(radar)
display.plot_ppi_map('corrected_velocity',
sweep=0,
resolution='50m',
vmin=-30,
vmax=30,
projection=ccrs.PlateCarree(),
colorbar_label='Radial Velocity (m/s)',
cmap='balance',
gatefilter=gatefilter)
plt.show()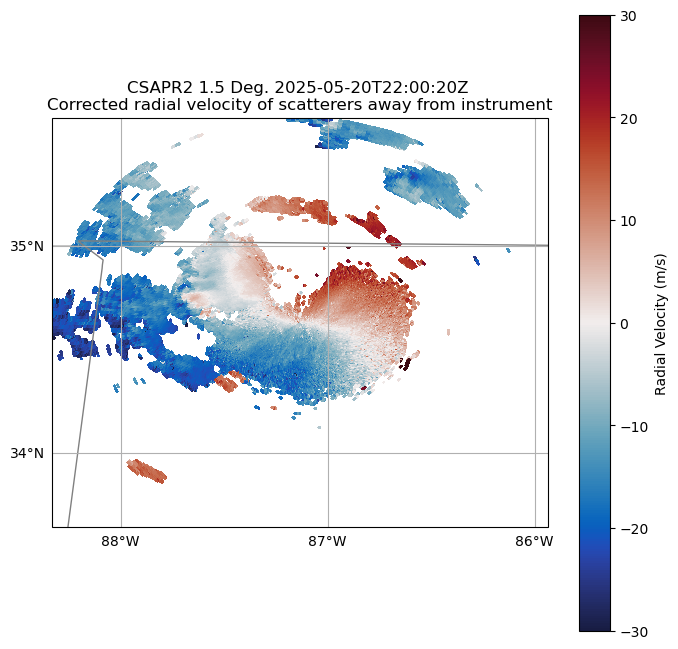
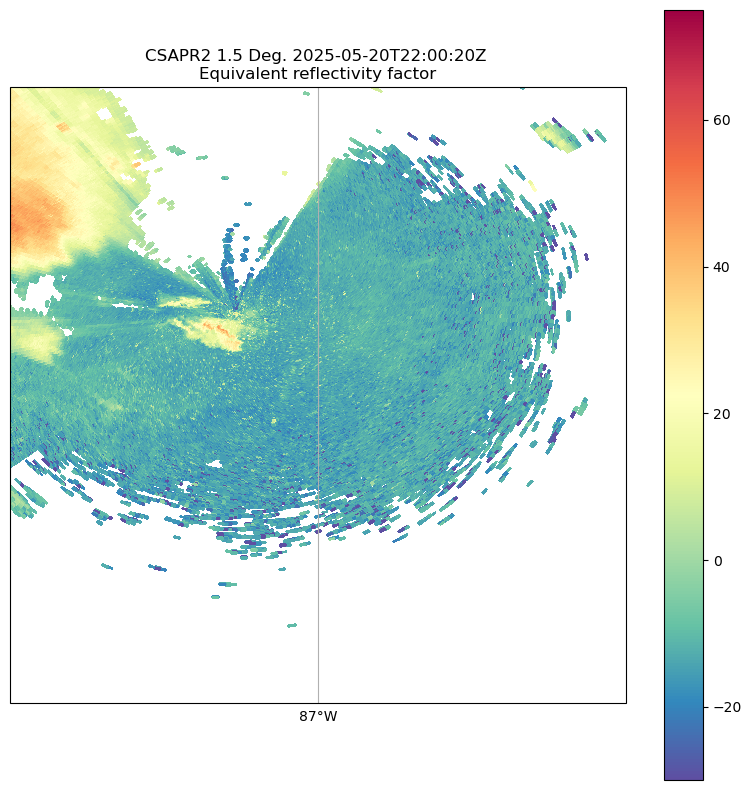
# loop thru files and plot reflectivity
for file in filelist:
    radar = pyart.io.read(file)
    outpath = "/data/home/kbritton/bnf-deep-convection/imgs/csapr_ppi/" + file[-18:-3] + '.jpg'
    # plot reflectivity
    fig = plt.figure(figsize=[8, 8])
    display = pyart.graph.RadarMapDisplay(radar)
    display.plot_ppi_map(('reflectivity'),
                     sweep=0,
                     resolution='50m',
                     vmin=-20,
                     vmax=60,
                     projection=ccrs.PlateCarree(),
                     colorbar_label='',
                     cmap='Spectral_r',
                     gatefilter=gatefilter)

    #display.set_limits(xlim=(-87.5,-86.5),ylim=(34,35))
    #plt.show()
    plt.tight_layout()
    plt.savefig(outpath, dpi=150)
    plt.close()
radar = pyart.io.read(file)
outpath = "/data/home/kbritton/bnf-deep-convection/imgs/csapr_ppi/" + file[-18:-3] + '.jpg'
# plot reflectivity
fig = plt.figure(figsize=[8, 8])
display = pyart.graph.RadarMapDisplay(radar)
display.plot_ppi_map(('reflectivity'),
sweep=0,
resolution='50m',
#vmin=-20,
#vmax=60,
projection=ccrs.PlateCarree(),
colorbar_label='',
cmap='Spectral_r',
gatefilter=gatefilter)
display.set_limits(xlim=(-87.5,-86.5),ylim=(34,35))
plt.tight_layout()
plt.show()
# gridding
z_grid_limits = (0.,15_000.)
y_grid_limits = (-60_000.,60_000.)
x_grid_limits = (-60_000.,60_000.)

grid_resolution = 500
def compute_number_of_points(extent, resolution):
    return int((extent[1] - extent[0])/resolution)
z_grid_points = compute_number_of_points(z_grid_limits, grid_resolution)
z_grid_points30x_grid_points = compute_number_of_points(x_grid_limits, grid_resolution)
y_grid_points = compute_number_of_points(y_grid_limits, grid_resolution)
print(z_grid_points,
y_grid_points,
x_grid_points)30 240 240
grid = pyart.map.grid_from_radars([radar],
grid_shape=(z_grid_points,
y_grid_points,
x_grid_points),
grid_limits=(z_grid_limits,
y_grid_limits,
x_grid_limits),
)
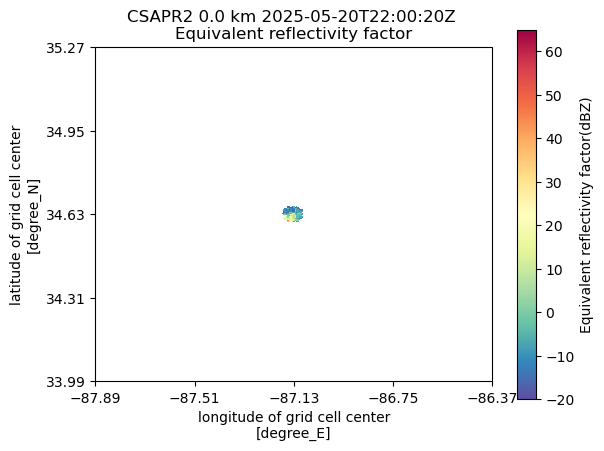
grid<pyart.core.grid.Grid at 0x7fad14ef1b50>display = pyart.graph.GridMapDisplay(grid)
display.plot_grid('reflectivity',
level=0,
vmin=-20,
vmax=65,
cmap='Spectral_r'
)